Sunday Times 2
Map reveals the countries with the world’s worst air pollution
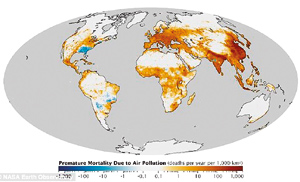
Air pollution is said to account for 2.1 million premature deaths worldwide, according to new research, and mortality rates can vary widely between certain countries. To highlight the risk, Nasa’s Earth Observatory has used these numbers to create an air pollution map that shows, at a glance, how levels of a type of pollution called fine particulate matter differ across the globe.

This map uses air pollution data gathered by the University of North Carolina. Dark brown areas have more premature deaths than light brown areas. The areas shown in blue represent countries where air quality has improved in relation to data previously held about pollution from the 1850s (NASA)
It compares data compiled on 1 January 1850 to levels recorded on 1 January 2000 and shows the average number of deaths per 1,000 square kilometres, per year. The data was collected by researcher Jason West, an assistant professor of environmental sciences at the University of North Carolina.
In a study published in the journal Environmental Research letters, West estimated that around 2.1 million deaths a year are linked to levels of fine particulate matter (FMP). Fine particulate matter is made up of particles, such as dust and soot, that are 2.5 micrometres or smaller.
Because of this size, the particles are scientifically referred to as particulate matter 2.5, or PM2.5. They cause health problems because they are small enough to enter a person’s lungs. PM2.5 is released from car exhausts, for example, as well as other industrial, domestic and natural sources.
According to a blog post from Nasa’s Earth Observatory: ‘Dark brown areas have more premature deaths than light brown areas. ‘Blue areas have experienced an improvement in air quality relative to 1850 and a decline in premature deaths.’
‘Fine particulate matter takes an especially large toll in eastern China, northern India, and Europe – all areas where urbanisation has added considerable quantities of PM2.5 to the atmosphere since the start of the Industrial Revolution.’
It continued that areas, such as the southeastern states of the U.S., saw levels of PM2.5 drop to levels seen before the development of industry.
‘The decrease in PM2.5 is likely related to a decline in local biomass burning that has occurred over the last 160 years,’ explained the post.Nasa’s Earth Observatory claims that toxic pollution can linger in the air for ‘days or even weeks’ and increases the number of people admitted to hospitals with breathing or heart problems.
© Daily Mail, London
comments powered by Disqus
