- Last Update 2026-05-14 17:18:00

The Coronavirus Pandemic: Doubling Time and Active Cases as Most Important Indicators
By TharosaMissakaRajaratne – tharosa1942@hotmail.com (Faculty of Science University of Peradeniya)
Introduction
Doubling time is a mathematical concept which yields the amount of time for a particular population to double in its size, i.e. “How long it would take N to be 2N” Conversely, the number of a population at any given time could be obtained for a predetermined doubling time value, i.e. “How much N would be at the day x if N doubled every y days”. This concept has been in application since the days of Babylonian Mathematics in the field of calculating loan interests.The same concept is applicable to phenomena that are subjected to grow over time.
The theory of doubling timecan be employed as an effective indicator to measure the severity of the Coronavirus outbreak and the overall effectiveness of the remediation process executed by a particular country. In this pandemic scenario, both of the aforementioned concepts [“How long it would take N to be 2N” and “How much N would be at the day x if N doubled every y days”]can be used as useful indicators. For the latter concept, a continuous graph could be plotted by using the parameters of active cases in a particular country and the number of days elapsed after the first confirmed case of that respective country. Several baselines that reflect the gradients of few selected doubling times are introduced to the graph to compare the behavior of the growth.
The semi-logarithmic method helps to assign the exponentially growing variable to a logarithmic scale (i.e. linearizing the variable), while retaining the other variable as linear by default. In the following graph, the semi-log relationship between the number of active cases (logarithmic) and the number of days elapsed after the first confirmed COVID-19 cases of China, Italy, South Korea, United States, and Sri Lankaarereported. It should be noted that due to the lack of diagnostic information during the initial period, the statistical timeline of China starts from December 31st 2019 with 27 active cases. The United States and South Korea had positive COVID-19 cases by as early as 22nd January 2020, and Italy by 31stof the same month. Sri Lanka reported its first positive case on 11th March.

Figure 1 - COVID-19: Cumulative Active cases: Worldwide. Selected Countries – Mainland China, Italy, South Korea, Japan, United States, and Sri Lanka (Data: JHU CSSE, March 29th 2020)
The markers that are added onto the curves of Mainland China, Italy, South Korea, and United States indicatethe respective nearest incidents that took place before that would have likely attributed to escalate the then-ongoing outbreak into an epidemic within the country.
The dinner involving 40,000 families in China, the Patient No.31 incident in South Korea, and the Lombardy clustered outbreak in Italyshow the transition of the disease from an outbreak to an epidemic. The marker pinned on to timeline of The United States relates to identification of 36 COVID-19 positive individuals from the Diamond Princess Cruiser. Since then, until the 49th day, several state and counties have been reporting an alarming increase of COVID-19 cases. Yet a nationwide testing processwas not introduced until 10th March.Consequently, the country rapidly stepped into an epidemic situation.
The shape of the curve and the gradient of it indicate the trend the epidemic would take in a constructive manner.Despite the breaching situation that was taken place in Mainland China and South Korea, it can be seen that both these countries have been able to quickly increase the doubling time of active cases. The increasing of the doubling time results in a decreasing gradient and eventually a negative gradient. Although the number of confirmed cases makes a considerable contribution to determining the death toll,the population of the active cases plays a critical role in determining the death toll; hence selecting the active case population instead of the confirmed cases would return a much straightforward graph indicating the degree of the severity of the epidemic.
Italy despite having maintained lower active cases for a longer time at the beginning compared to other countries, showed a similar spike in active casessimilar to that of Mainland China and South Korea, but due to the shortcomings of the remediation process of Italy its gradient decreased at a slower rate. In the United States,on the other hand, after its spike, the number of active casesincreased in a dreadful manner. Towards the tail of the curve, a little decrease in the gradient isobserved. Unless an explicitly rigorous remediation process is executed in the United States, a catastrophe awaits to take place.Japan although indicates an increase of active cases, it is certain that the controlling is much effective than Italy and the United States. The following graph shows the efficacy of controlling carried out by selected countries in Asia.
Sri Lanka, despite having reported the first case as late as in mid-March (excluding the case of the Chinese citizen),experienced a steep increase in cases during the first two weeks. The remediation process has shown fruitful as for now however. The gradient of the active cases has decreased drastically and momentarily. However because of uncooperative individuals, several clustered cases have been reported. If these clustered cases pilot a surge of infection, a scenario similar to that took place in other countries could occur in Sri Lanka also. And given the economic andhealthcareinfrastructuraldifferences between Sri Lanka and other countries, veraciously Sri Lanka is now in a crucial phase.
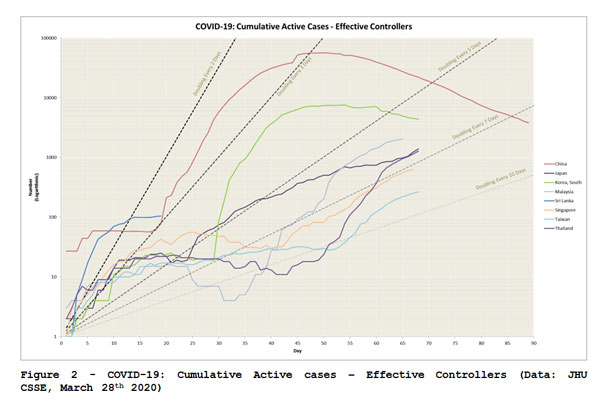
Figure 2 - COVID-19: Cumulative Active cases – Effective Controllers (Data: JHU CSSE, March 28th 2020)
Logarithmic representation of data is sometimes effective in amplifying minute fluctuations while compressing values that are several powers of 10 (in this graph) apart. Moreover, utilizing the concept of doubling time as a baseline in comparison and prioritizing the population of active cases in analyzing diseases statistics shows a much accurate image of the direction of the epidemic over the conventional linear methods.

-
Still No Comments Posted.


Related Articles

Heavy showers to continue in several provinces, over 30,000 affected
- 14/05/2026 - 26 - 0

Top stories of the day
- 14/05/2026 - 31 - 0

Top stories of the day
- 13/05/2026 - 93 - 0

InPix: Mahinda Rajapaksa leaves Bribery Commission after recording statement
- 13/05/2026 - 27 - 0
Leave Comments