- Last Update 2026-05-12 11:07:00

Economics of Electricity: A Supply Side Reflection
By Dr. Y Ratnayake, former Senior Consultant, Sri Lanka Institute of Development Administration.
Background:
The subject of electricity and fissile fuel prices has become a dominant conversational topic in social media as well as in polemic discussions on almost a daily basis because their spiraling prices, like the tentacles of an octopus, can deliver a crippling grip on all manufacturing, service and the household economic activities without an exemption of a single economic sector of the whole country.
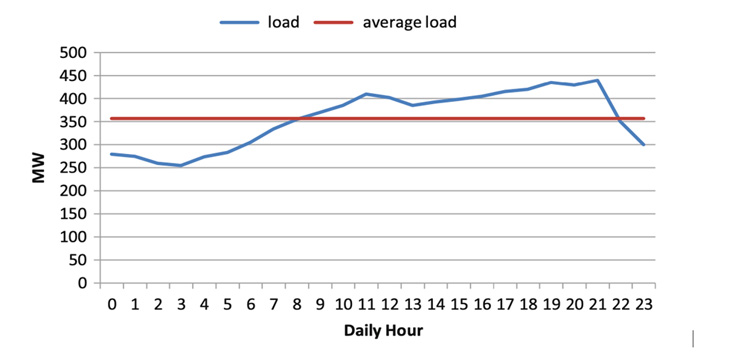
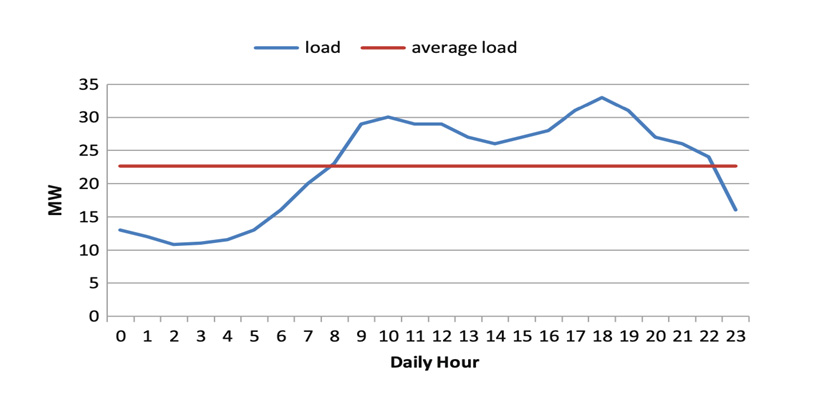
Electricity and socialism, Lenin of Soviet Russia used to say, equal communism. This means that electricity performs the role of the booster in providing momentum to accelerated economic development as it provides a source of low-cost energy required for the continuous operation of production mechanisms irrespective of sectoral or geographical differences. Figure 1 given below illustrates the general pattern of electricity demand in any country subject to the variances that can occur in relation to the load or volume.
Figure1.
Average Pattern of Power Consumption.
Based on the characteristics of electricity consumption, power load distribution can be categorized under the following economic subsectors of the country.
Agricultural
Industrial
Commercial
Residential
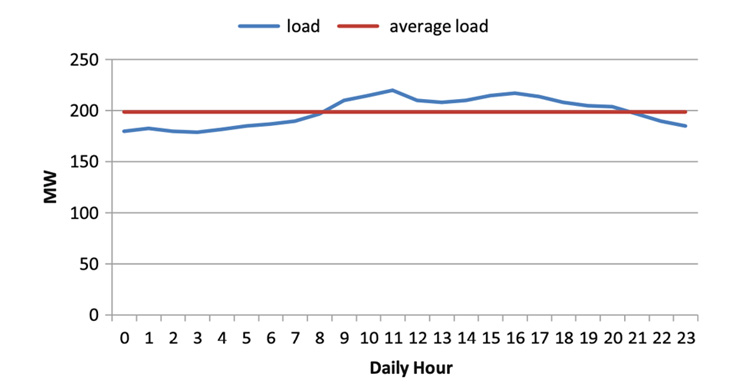
Figure 2.
The Daily Load Curve of the Industrial Sector in a Hypothetical Region
The power consumption pattern and growth of its demand in any given country can vary in tangent with the respective economic development stage of the country, time of the day, industrial structure, relative mass of economic subsectors, magnitude of business etc. which are graphically illustrated in the figures inserted in the article. As Figure 1 above illustrates, electricity utilization in any geographical region moves into high intensity coinciding with the daytime, to be specific, from 8.30 hours to 21.00 hours, since economic activities related to the production of goods and services are predominantly congregated during the daytime.
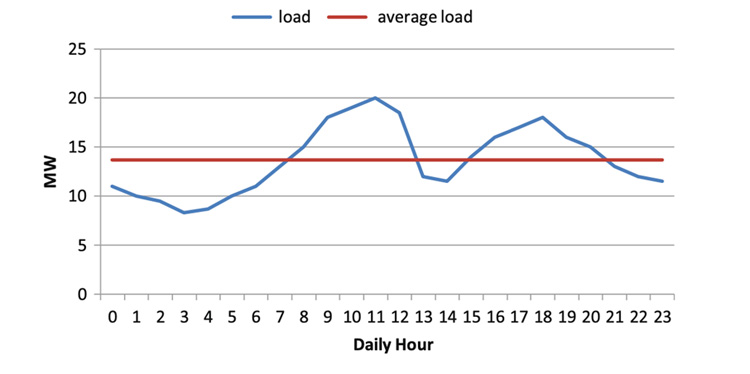
However, within the total load, demand for electricity by the sub-sectors that absorb energy from the total load is characterized by variations with regard to the time span within which each sector commences, reaches its peak and shrinks its demand. For instance, the agricultural sector is characterized by higher utilization with two peaks during the day time as depicted in the Figure 3.
Figure 3.
The daily load curve of agriculture in a certain region
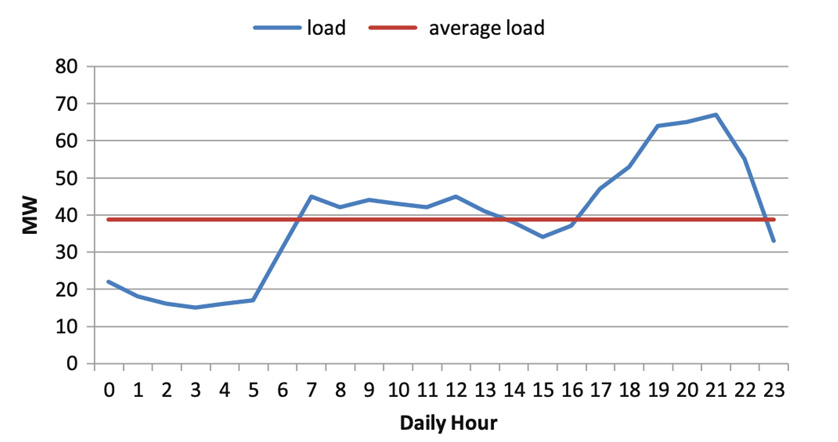
As against the agricultural sector, the power consumption pattern associated with the commercial or business sector demonstrates a consistent level of electricity consumption extending from 8 to 23 hours in many countries. The power consumption curve representing the residential sector is remarkably skewed towards the evening hours and switches to a descending trend closer to the wee hours of the day.
Figure 4.
The daily load curve of residential power load in a certain region
Relationship Between Economic Growth and Electricity Demand:
Economic growth of any country is generally assessed, inter alia, on the basis of GDP which inclines an upward movement due to the expansion of production of goods and services in any given economy. The economic growth momentum is accompanied by an increasing demand for electricity, as witnessed in numerous countries in the world including Japan and China, if the economy depends on electricity as the main source of energy. In other words, the continuous availability of electricity in adequate volumes in keeping with the demand can be construed as a sine qua non for the accelerated economic growth of a country.
As reported in the annual reports of the CEB, electricity demand in the country during the last fifteen years has been growing at an average rate of about 4.8 percent per annum while peak demand has been growing at a rate of 3.1 percent per annum.
Figure 5
The daily load curve of the business power load in a certain region
Supply of Electricity:
The electricity production and distribution, a sector that wields an overwhelming influence on all the other economic activities of the country, is predominantly controlled by a state-owned corporation, the Ceylon Electricity Board (CEB), with the private sector contribution in generation and distribution is a relatively insignificant proportion in contrast to the total volume of country’s electricity requirements. Irrespective of the minor contributions made to the power grid by the private sector, CEB has maintained its dominance continuously as one of the largest state-owned enterprises (SOE) in the power sector of Sri Lanka. However, it is interestingly one of the biggest loss making SOEs which are a huge burden to the public and the exchequer. During the period of 10 years from 2010 to 2019, the CEB had accumulated a loss of over LKR 246 billion. This is most likely to increase further in 2020 as there was an additional loss of over LKR 62 billion incurred during the year by CEB.
Hydropower, thermal coal, and thermal oil power plants are the key power generation sources of Sri Lanka accounting for 92 percentf the power generated on average in the last 5 years. Other non-conventional renewable energy sources such as wind power contributes only a small proportion, eight percent on average over the last 5 years.
Profitability and Sources of Power Generation:
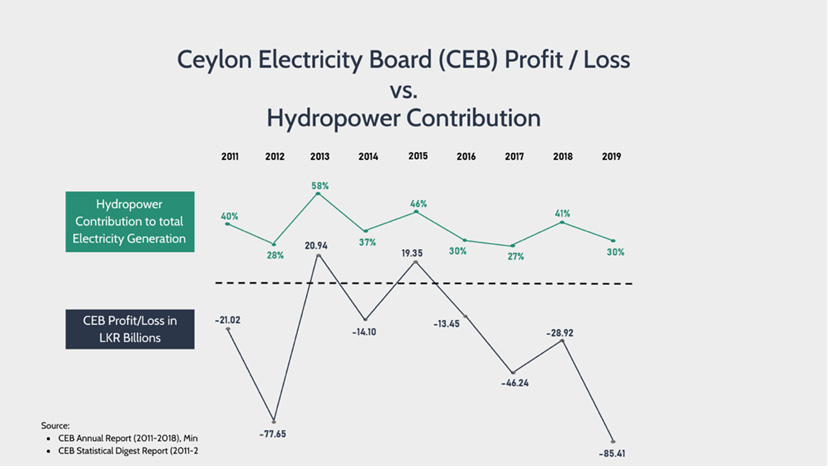
On average in the last 10 years, 66.9 percent of CEB’s total costs is classified as the power generation costs. The composition of the source of power generation highly impacts the profitability of the CEB. As hydropower has the least generation cost, CEB’s profitability improves during years the hydropower contribution to the total electricity generation increases and vice versa as shown in the Infographic below. The infographic also demonstrates that the positive relationship between hydropower contribution and CEB’s profitability is consistent throughout the period from 2011 to 2019. In 2013 and 2015, share of hydropower generation peaked at, fifty eight and forty six percent respectively. It was only in 2013 and 2015, CEB managed to generate a profit as opposed to the loss it made in the other years.
Figure 6.
Vital Statistics:
The latest annual report of the CEB indicates that the total consumer accounts of the CEB stand at 6,636,266, with a recorded revenue of LKR 238,911 million. The cost of sales is recorded as LKR 302,949 million while the average cost is assessed as 21.21 LKR/kWh which can be contrasted with the selling price 16.72 LKR/kWh. The above operations are handled approximately by 25,624 employees which leads to the ratio the earnings per employee as Rs 9323.71.
Cost Analysis:
The cost of generating power varies considerably based on the power source. The Infographic above shows the unit cost of generating power in 2020 from the key power plants that generate over 50 Gigawatt Hours (Gwh) annually. The figures show that the unit cost of generating power from the hydropower plants is the lowest compared to other sources of power generation in Sri Lanka. Amongst the powerplants considered in the Infographic, the unit cost of generating power from the hydropower plants averaged LKR 5.0 per Kwh during the year compared to LKR 10.2 per Kwh of coal power plant, LKR 16.8 Kwh of Non-conventional renewable energy. Thermal Oil power plants indicate a substantially high average of LKR 32.9 Kwh of the.
According to Dr. Siyabalapitiuya (2023), Sri Lanka has the highest price of electricity for industry in South Asia. Along with all other constraints, electricity costs too are a reason to drive industry away from Sri Lanka. Sales to industries have not been growing for some time, even before the economic crisis. Sales to industries dropped by ten percent in 2022 which certainly is a reflection of the impacts exerted on GDP by the spiraling electricity prices.
The unit price of electricity generally reflects the cost to construct, finance, maintain, and operate power plants and the electricity grid, the complex network of power transmission and distribution lines.
The key factors that contribute to the end selling price of electricity in Sri Lanka encompass fuel cost, power plant capital cost, transmission and distribution cost, and administrative expenses of the institution, namely CEB, that manages the entire power supply system in the country.
Table 1.
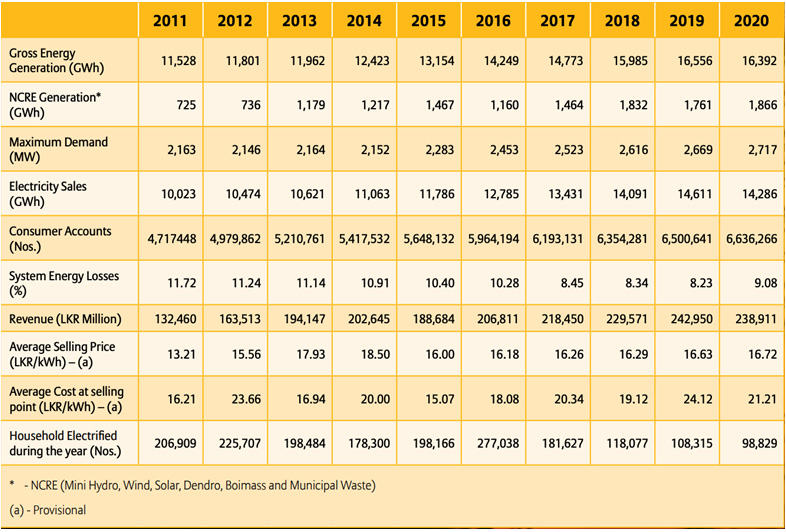
Source: CEB.
As revealed by the annual report of the CEB, 2020, the unit cost of electricity at the selling point stood at Rs 16.21in 2011 which was increased to Rs 21.21 in 2020 registering an increase of 30.84 percent over a period of ten years. In the meantime, the same source indicates that the selling price of a unit of electricity was Rs 13.21, showing a difference of three rupees between the cost and the sales price, which moved over to the level of Rs.16.72 in 2020 equivalent to an increase of 26.57 percent over ten year period.
According to a report published by the Indian Power Ministry, it has been pointed out that the production cost of an electricity unit in Sri Lanka is over twice more than the amount India spends on a unit. (the “Deshaya” newspaper reports)
The above report further goes into details stating that India spends only 25 Sri Lankan rupees to generate a unit of electricity, which may explain the reason, inter alia, for enabling India to produce many industrial goods and agricultural crops relatively at a lower cost than the cost incurred by the Sri Lankan farmers.
However, Sri Lanka currently spends 52 Sri Lankan rupees to generate a unit of electricity.
It is stated that the main reason for the high cost gap in Sri Lanka is largely due to the dependency on coal for its power generation, which is relatively costlier than the power generated through other sources. Although wind power and solar power are also used for electricity production in Sri Lanka, the percentage contribution to the total need is very insignificant and it cannot thereby exert a sufficient force on driving the unit cost of production downwards.
Manpower and Emolument Cost:
As at the end of the year 2020, the total workforce was 21,262 permanent employees, 1,485 casual employees, 118 contract employees and 2,759 trainees under the 4-year apprenticeship training scheme. The employees of different echelons in the CEB are highly unionized and thereby very often found to be in a position to manipulate organizational operations in such a way to benefit themselves at the expense of the CEB and the country by extension. Allegations galore very often in the public media against the CEB, the monopoly behind the power supply. Extravagant expenses, above average emolument packages, corruption in different forms and different levels, arm twisting practices of the engineering professionals are the main malaises that contribute to the exponential increase of the cost of production in contrast to that of many other countries in Asia and Europe. It is further alleged that organized movements and work groups with vested interests within the CEB purposely obstruct the potential of the organization in venturing into relatively less expensive power generation sources such as solar, wind power, renewable energy etc. since the status quo provides immense lucrative pecuniary benefits to the interested groups.
Table 2.
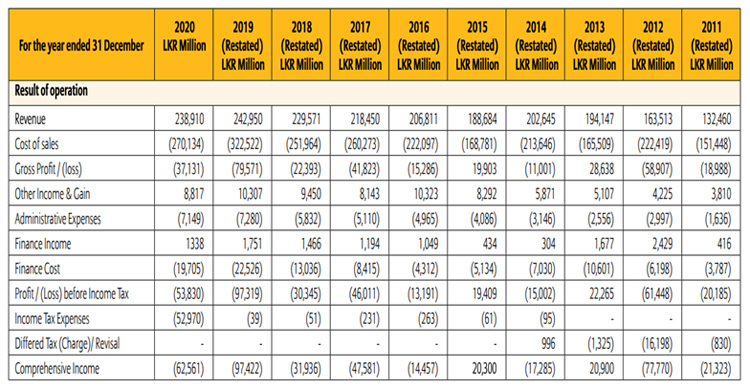
Source: CEB.
As illustrated in Figure 6, the CEB has been able to operate profitably only when the hydropower contribution to the national grid is at its maximum but the problem associated with hydropower is its dependency on rain god whose behaviour is precarious and erratic due to the changing climatic pattern. Furthermore, the subject specialists believe that the electricity loss in transmission is above the acceptable limits which finally makes the power users pay a higher unit price as the losses should be recovered by hiking the price of actual joules that reach the households and the industries.
Electricity and Economic Growth:
Economic growth and electricity are positively correlated which empirically demonstrates that, during an increasing production period, a higher electricity demand is generally experienced indicating overall higher demand for factors of production that remained dormant in the factor market. If the relationship is linked to the job potentials of employment generation, mainly the job creation, then one can plausibly predict the capability of the power sector to generate more jobs for the unemployed. In China, for instance, the increase of 1 million kWh electricity demand in industry can provide 29.9 jobs in industry; it is 370.1 in commercial. In the United States, it is 44.3 in industry and 46.9 in commercial.
The main pillars that bear the burden of the Sri Lankan economy, namely tea, rubber, coconut and apparel sectors, basically depend on the use of electricity as the source of energy therefore their capabilities to remain afloat in the competitive international markets hinge upon the availability of relatively low cost energy, in particular electricity. For instance, Sri Lanka produces about 300 million kg of tea with the collective contribution made by 600 factories in operation in the country. According to an energy audit carried out in the past, the total energy usage for tea processing is about 25.4 MJ per kg of made tea, which consist of about 3.4 MJ of electrical energy and 22.0 MJ of thermal energy. On the basis of 300 million kg of production per annum, the total energy usage by the tea industry is 283 GWh of electrical energy, and 6,600 tera Joules of thermal energy per annum. The cost of thermal and electrical energy is about thirty percent of the total cost of tea processing (Rs.47.00). The cost of energy is increasing with increasing electricity tariffs. Therefore it is necessary to find alternative energy resources and energy-saving techniques for factories, to reduce the cost of electricity in tea processing. (Tea Research Institute of Sri Lanka.)
Unlike the situation in the tea and rubber sectors, the apparel industry solely depends on electricity for almost all operations performed in a garment factory from cutting cloths to the packing of the final product, clothes. The price of a finished product of clothing is made up of material, labour and electricity costs, comprising more than seventy percent of the total with other expenses playing a low-key role in determining the markup price.
From the perspectives of electricity users, the impacts of electricity on the economic growth of the country and the advancement of patronaging industries can lead to four possible scenarios, either in positive or negative directions, such as accessibility or availability, electricity voltage or quality, frequency of supply breakdowns and affordability of cost to the industry. As far as the cost factor is concerned, a high unit price obviously compels marginally profitable business units and heavy users of electricity to think twice whether to remain in business or exit from the current manufacturing activities provided that electricity is a major component in the total cost structure.
As it has often been alleged, generous incentive schemes implemented by the CEB for the benefit of its staff, sometimes camouflaged under fanciful labels are a major contributory factor for the escalation of production cost which remained uninvestigated with the covert or overt aegis of bureaucratic administration that functions like a mafia within the institute. In a recent press briefing, the minister in charge of the CEB made some references to the above allegations and provided some affirmative evidence to prove the existence of extremely generous emolument schemes in favour of the CRB employees.
When ignorance rules an organization, what happens to the rest of the world resulting from its action is nobody’s business.

-
Still No Comments Posted.


Related Articles

Nearly 200 foreign nationals arrested over suspected cybercrime offences
- 12/05/2026 - 26 - 0

Top stories of the day
- 11/05/2026 - 81 - 0

Former Energy Minister endorses three points at pre-trial session
- 11/05/2026 - 81 - 0
Leave Comments